Natural or man-made: what factors are responsible for the climate changes we are seeing today? Ahead of the release of the latest IPCC report next week, Marion Ferrat discusses the different factors affecting climate change and shows that who takes the blame all depends on timing…
Over the past century, our planet’s climate system has been changing. Changes in the composition of the atmosphere, holes in the ozone layer, warming temperatures and sea level rise are only some of the factors that have been observed worldwide.

Earth taken by the crew of the Apollo 17 spacecraft – Source: NASA, Wikimedia Commons.
A fixed observer looking at our planet for the past few billion years would have seen patterns of warming and cooling of its surface, ice sheets growing to the tropics or shrinking to the tips of the poles, deserts forming, seas drying, oceans overturning and vegetation changing. So who is to blame for our current changing climate? Is climate change natural or man-made?
What factor is most important in driving climate change really depends on the timescale you consider. So let’s take a short journey through climate space and time to shed more light on who is to blame for climate change.
The million-year climate change: blame the continents
The hundred thousand-year climate change: blame the Sun
The thousand-year climate change: blame the climate!
The 21st century climate change: blame ourselves
The million-year climate change: blame the continents
The Earth’s climate history is divided into primary climate periods, millions of years long, of increase or decrease in the temperature of the Earth’s surface and atmosphere. These periods are referred to as Greenhouse Earth and Icehouse Earth (or Ice Age), respectively.
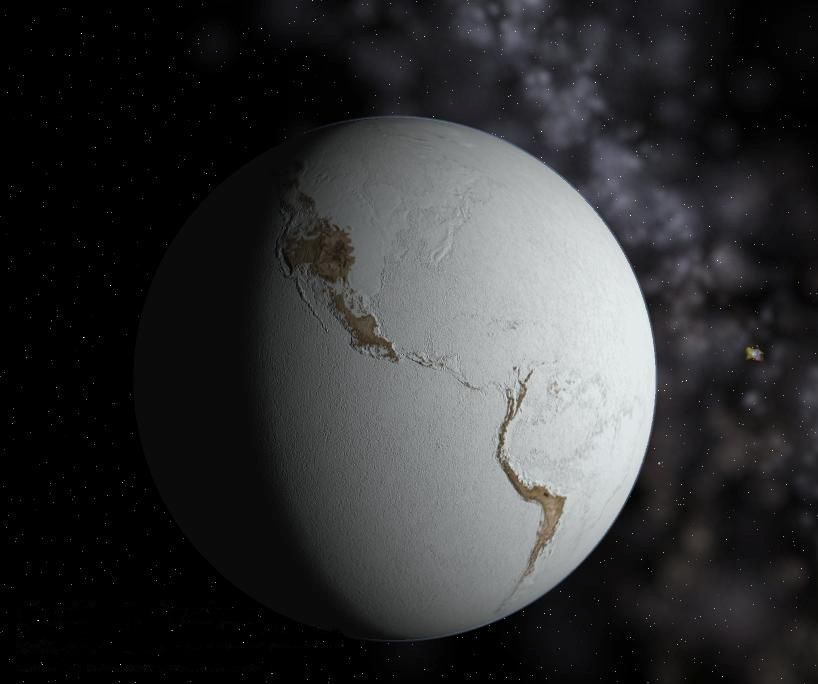
Fictional representation of a ‘Snowball Earth’ – Source: Neethis, Wikimedia Commons.
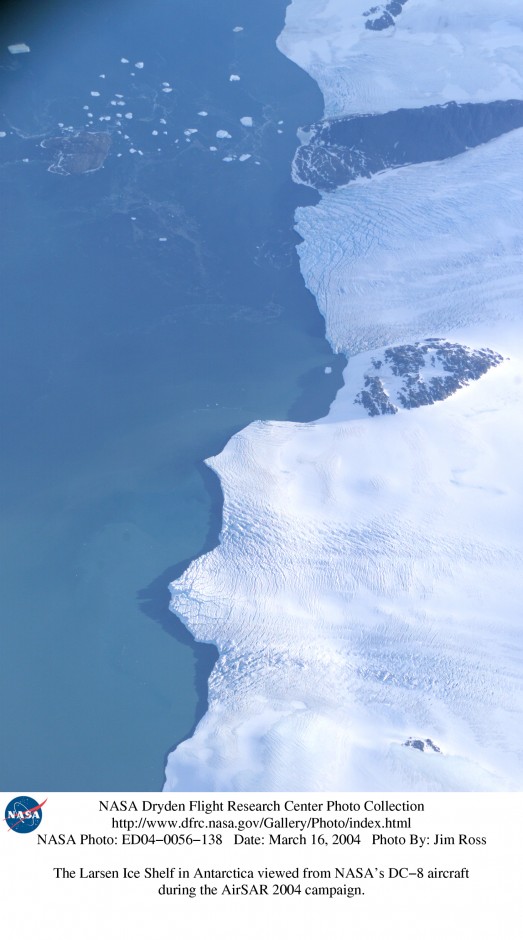
The main characteristic of an Ice Age or Icehouse world is that permanent ice sheets are present at the surface of the Earth. The thick ice sheets covering Greenland and Antarctica today mean that we are currently living in an ice age, which began 2.6 millions of years ago.
In a Greenhouse world, on the contrary, ice sheets and glaciers are absent from the surface of the Earth. At the height of these times, carbon dioxide levels in the atmosphere can vary between a few to a few hundred times their present level.
The exact causes behind shifts between greenhouse and icehouse worlds are still debated but scientists agree that two factors play an important role: the position of continents at the surface of the Earth and the concentrations of greenhouse gases (mainly CO2 and methane) in the atmosphere.
Animation of the breakup of Pangea – Source: USGS, Wikimedia Commons.
The position of the continents and oceans is important in driving the million-year-long climate cycles as it has a huge influence on atmospheric composition and oceanic flows (see this cool animation showing the movement of the British Isles over geological time!). For example, the grouping of continents in particular places can stop the flow of warm water from the equator to the poles and cool down polar water, until ice sheets begin to form.
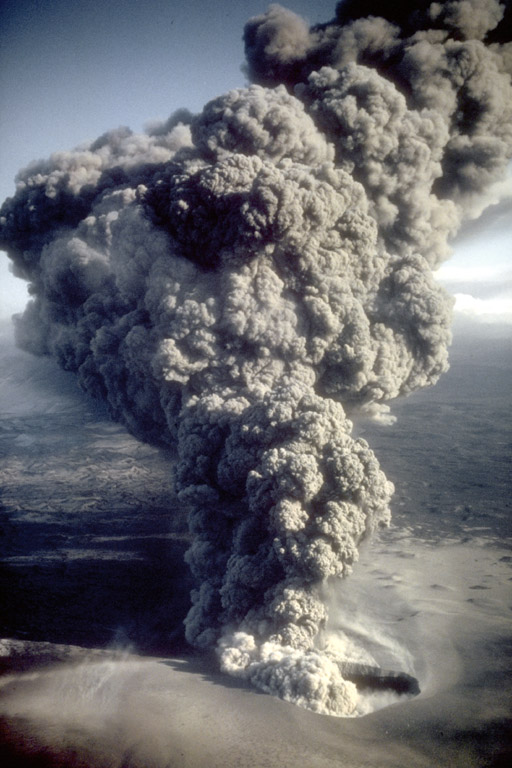
Eruption column rising from the east Ukinrek Maar crater in Alaska – Source: R. Russell/USGS, Wikimedia Commons.
Plate tectonics can also drive climate change by influencing the concentration of CO2 in the atmosphere. The presence of large volcanoes can play an important role in driving long-term shifts from an icehouse to a greenhouse world because extensive volcanism can release large quantities of greenhouse gases into the atmosphere. Once enough CO2 builds up, the greenhouse effect kicks in and acts to warm the planet, pulling it out of its million-year ice age.
Once an initial change is triggered, the climate system will act to amplify it internally until the switch between ice and greenhouse world is complete.
The hundred thousand-year climate change: blame the Sun
Overlain on top of the huge greenhouse or icehouse periods are shorter, regular periods of climate change.
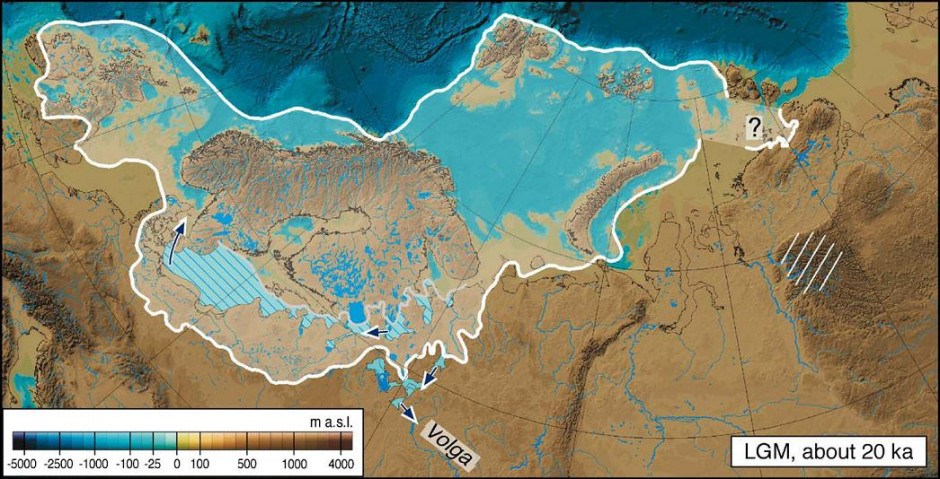
Over timescales of tens to hundreds of thousands of years, the Earth undergoes cycles of cooling and warming, driven primarily by small changes in the amount of energy received from the Sun. These periods are known as glacial and interglacial cycles, i.e. times within an ice age when the Earth is colder or warmer than average. We are currently living in an interglacial period called the Holocene, which began roughly 11,000 years ago.
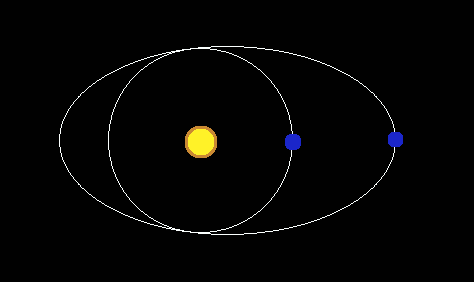
An example of changes in eccentricity.
Glacials and interglacials are driven by what we call orbital changes: small changes in the Earth’s orbit, which alter the amount of solar energy received at the Earth’s surface. These changes are cyclical and known as Milankovitch cycles, after the Serbian astronomer who first recognised them during the First World War.
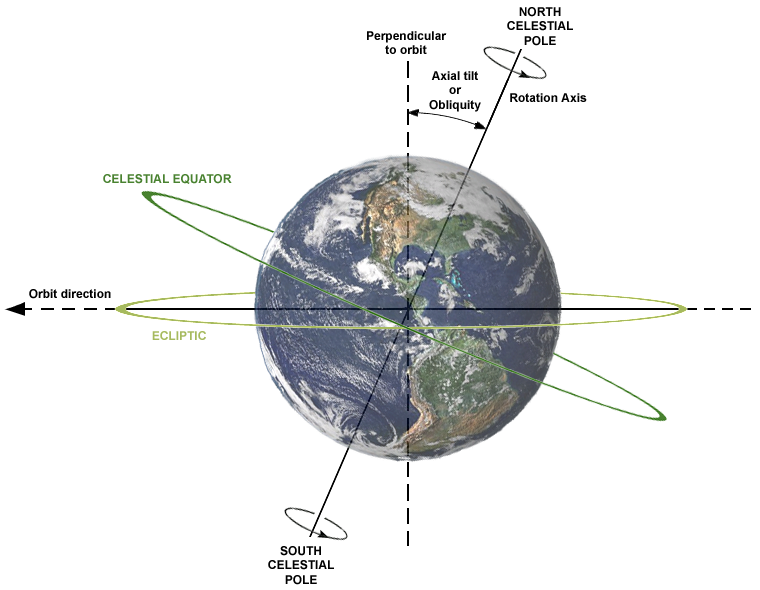
Obliquity or axial tilt – Source: Dna-webmaster, Wikimedia Commons.
There are three types Milankovitch cycles. The first, called eccentricity, is linked to the shape of the Earth’s orbit around the sun. The orbit changes from the shape of a circle to that of an ellipse over average timescales of roughly 100,000 years. When the orbit is more elliptical, the Earth is either closer or further away from the Sun than when the orbit is circular, driving changes in the amount of solar energy received at the surface. Climate data for the past 800,000 years show that ice sheets have grown and shrunk roughly every 100,000 years, likely driven by changes in eccentricity.
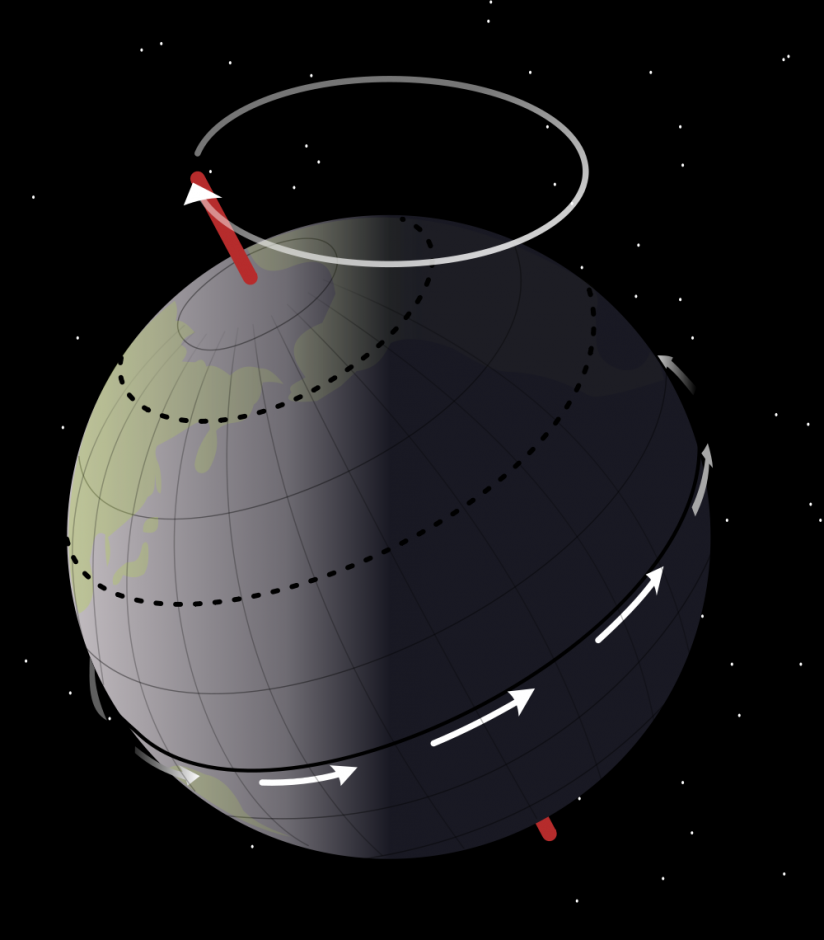
Precession of Earth’s rotational axis due to the tidal force raised on Earth by the gravity of the Moon and Sun – Source: NASA/Mysid, Wikimedia Commons.
The second type is linked to changes in the Earth’s axis. The Earth rotation axis is tilted; this tilt is largely what drives our seasons. The amount of tilt (or obliquity) also varies with time, over periods of roughly 41,000 years.
Finally, if one could watch the Earth from a fixed star in the universe, they would see its axis rotating slightly, a little bit like the wobble of a spinning top as it slows down. This is called precession and changes over periods of roughly 23,000 years.
The 100,000, 41,000 and 23,000-year Milankovitch cycles alter the amount of sunshine received on Earth and drive many changes in the Earth’s climate on these timescales, as has been observed in temperature and CO2 records.
The thousand-year climate change: blame the climate!
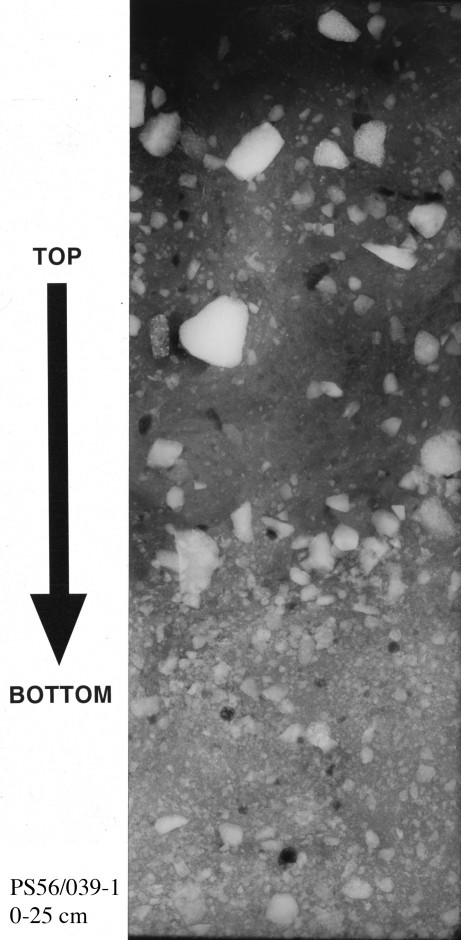
X-ray photo of surface sediment (0-25 cm) from the Southern Ocean with scattered gravel as ice rafted debris – Source: Hannes Grobe/AWI, Wikimedia Commons.
In the last decades of the 20th century, scientists began to find clues in the geological records of the North Atlantic Ocean and Greenland ice sheet that climate change was also occurring at higher frequencies than those linked to orbital and tectonic cycles.
Icebergs contain plenty of eroded rock and sediment. When they break-off into the ocean and melt, much of this material falls to the seafloor and can be seen as anomalies in the geological record called ice-rafted debris. Ocean cores revealed that thousand-year pulses of such debris could be found regularly throughout the past 100,000 years, suggesting rapid periods of iceberg break-off and discharge of cold water to the North Atlantic Ocean.
The Greenland ice cores also revealed that periods of rapid warming followed by slow cooling were occurring every few thousand years. These events seem to occur roughly every 1,500 years, though precise dating on these timescales can be difficult.
Such events are known as millennial cycles and are what scientists refer to as ‘abrupt’ climate change.
Similar changes have since been recognised in many locations, including the north Pacific Ocean and the tropics, suggesting that changes can be rapidly transferred between different regions of the globe by the climate system itself. One possible mechanism is that large bursts of cold water in the North Atlantic Ocean could alter the global circulation of ocean currents, which is largely driven by density changes in the North Atlantic region.
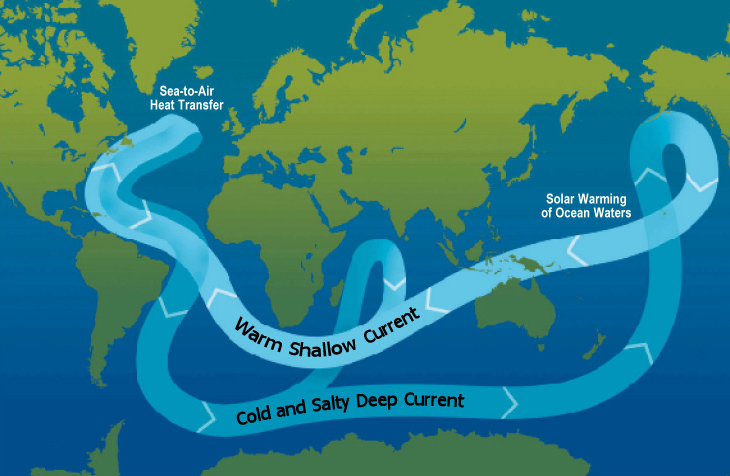
The global circulation of the oceans, known as the ‘conveyor belt’ – Source: Thomas Splettstoesser, Wikimedia Commons.
The 21st century climate change: blame ourselves
So Earth’s climate has changed drastically throughout the course of its history, driven by external factors such as changes in the Earth’s orbit and internal factors such as tectonics and physical connections between different parts of the climate system. Yes, these climate changes are natural and, yes, temperatures and CO2 have at multiple times been higher than they are today.
However, there are a few points worth making:
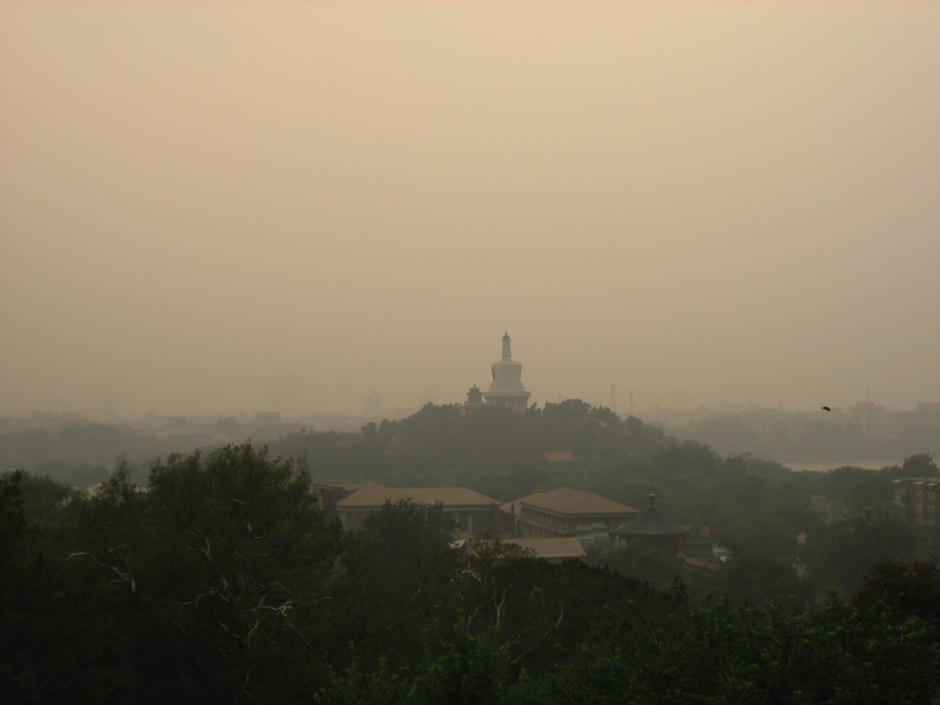
Smog over Beijing, China.
#1 – The most drastic changes have occurred very slowly, on timescales of hundreds of thousands to millions of years. These are thousands of orders of magnitude larger than that of a human life;
#2 – At all scales, atmospheric CO2 concentrations have played a huge role in climate change, contributing largely to the greenhouse effect, affecting ocean composition and acidity and being a crucial component of plant and animal life cycles;
#3 – Until the start of the industrial revolution, humans in our modern societies have evolved and lived through relatively stable climate conditions , with stable CO2 concentrations between 260-280 parts per million (ppm) for the past 10,000 years;
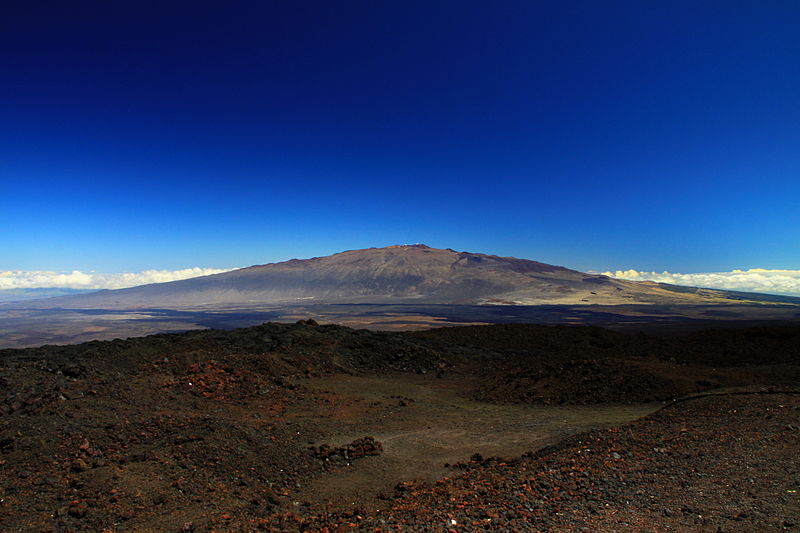
#4 – CO2 levels have constantly increased since the industrial revolution due to human emissions. A record global atmospheric CO2 concentration of 400 ppm was observed in May 2013 at the Hawaiian Mauna Loa observatory. This is the highest CO2 level in over 800,000 years, higher than any other interglacial period during this time.
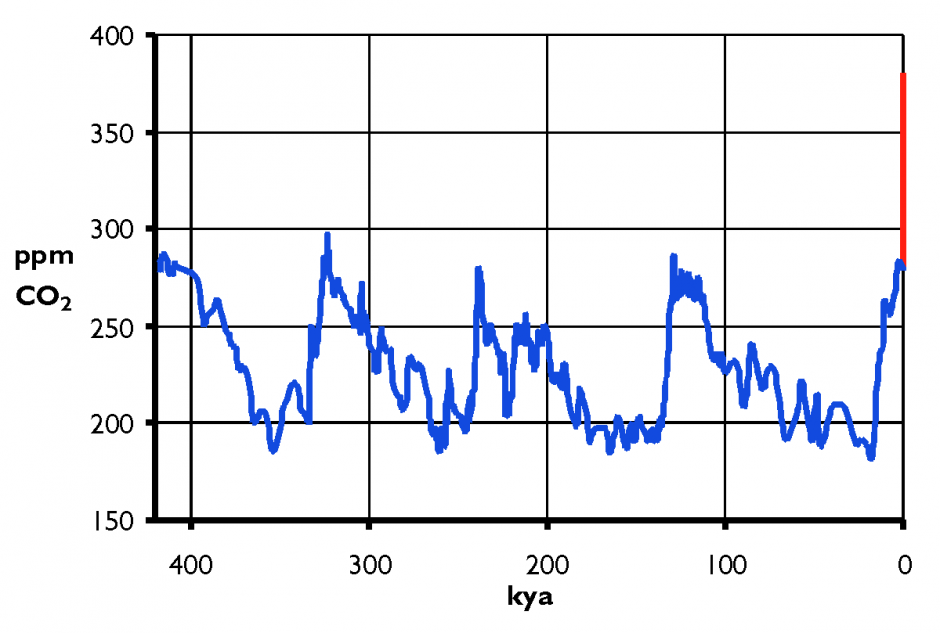
Atmospheric CO2 during the past 417,000 years (417 kya). Blue: Records from ice cores drilled at the Vostok station in Antarctica; Red: CO2 increase since 1800 due to anthropogenic emissions from fossil fuels – Source: Hanno, Wikimedia Commons.
The speed at which this human-induced rise in CO2 has occurred is worrying, increasing by nearly a third in just over 150 years.
The climate system will adjust to these changes over the next centuries as it has in the past. But the real issue is that these adjustments will not be in line with our modern inhabited world. As millennial cycles have shown, polar changes can be transferred between different regions of the Earth in ways that we still do not fully understand. Humans as a whole will likely adapt to future climate repercussions but particular vulnerable regions and communities will not.
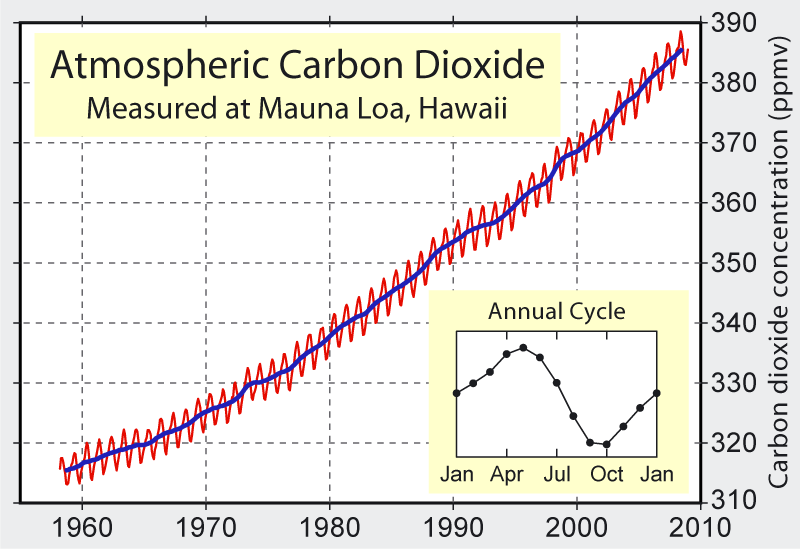
Atmospheric CO2 concentrations measured at Mauna Loa, Hawaii, since 1960 – Source: Robert A. Rohde, Wikimedia Commons.
Modern climate change is not a case of the end of the world but more of the end of the world as some people know it. Small islands and low-lying regions will suffer, so will areas affected by unpredictable droughts or floods.
By contributing in such an excessive way to concentrations of atmospheric CO2, humans are to blame for the climate changes we will continue to see in coming decades and even centuries; and not all of us will be able to adapt to it.