How can we learn more about the Earth’s interior by going into space? This edition of Minds over Methods discusses using satellite data to study the Earth’s lithospere. Anita Thea Saraswati, PhD student at the University of Montpellier, explains how information on the gravity of the Earth is obtained by satellites and how she uses this information to get to know more about the lithosperic structure in subduction zones.
 Sensing Earth’s gravity from space
Anita Thea Saraswati – PhD student, Géosciences Montpellier
From the basic physics we all know that the value of the gravity is a constant 9.81 meter per second squared. This assumption would be true if the Earth were a smooth nonrotating spherical symmetric body made of uniform element and material. However, because of the Earth’s rotation, internal lateral density variation, and the diversity of the topography (including mountains, valleys, oceans and glaciers), the gravity varies all over the surface. These tiny changes in gravity due to the mass variations could be a crucial hint for understanding the structure of the Earth, both on the surface and at depth.
The determination of Earth’s gravity field has benefited from various gravity satellite missions that have been launched recently. Among them are the Challenging Minisatellite Payload (CHAMP) (2000-2010), the Gravity Recovery and Climate Experiment (GRACE) (2002-recent), and most recently the Gravity field and steady-state Ocean Circulation Explorer (GOCE) (2009-2013). From these missions, finally a global high quality coverage of Earth’s gravity field became available. (Yay!)
GRACE observation data are very useful for the temporal analysis of changes in gravity. For example to detect the gravity signal before and after a big earthquake, like the Sumatra Mw 9.1 (2004) and Tohoku Mw 9.1 (2011) ones. By analyzing the changes of gravity signal during a certain period of time, it could also be used to detect the drought over a large scale area, which is used in several areas in Africa and Australia.
(text continues below figure)
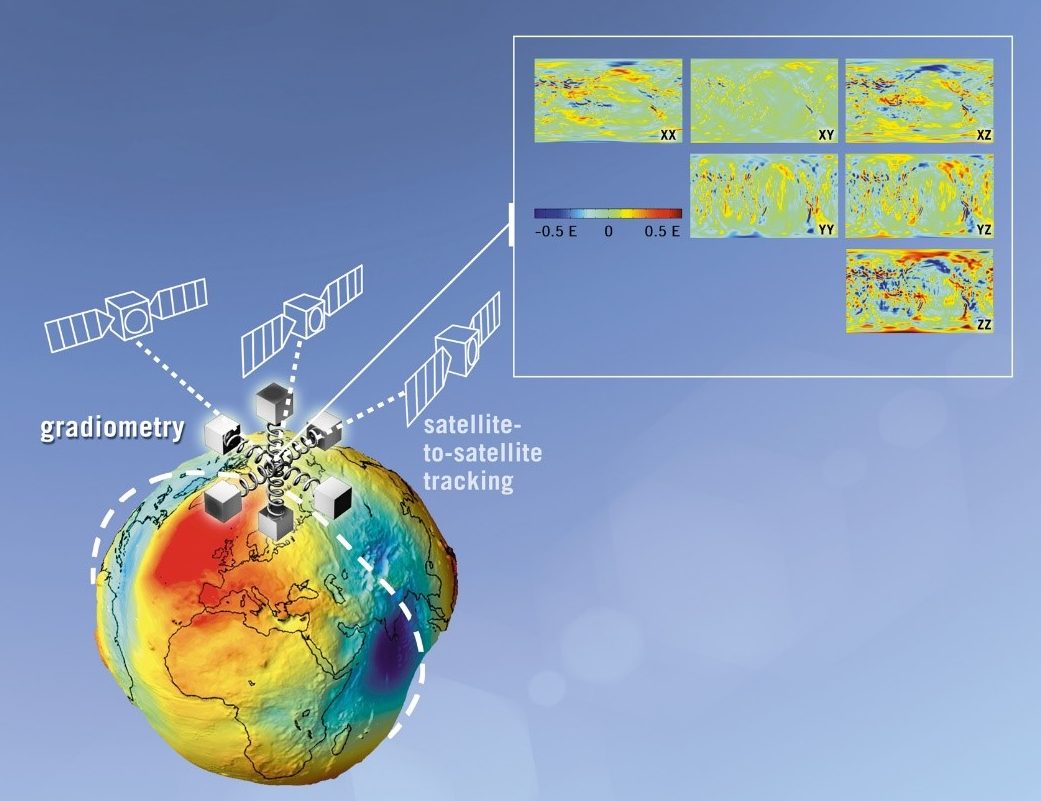
Design of GOCE satellite observation. A geoid’s shape is showed on the bottom left. On the top right, the GOCE gravity gradients in six components. (Source : ESA)
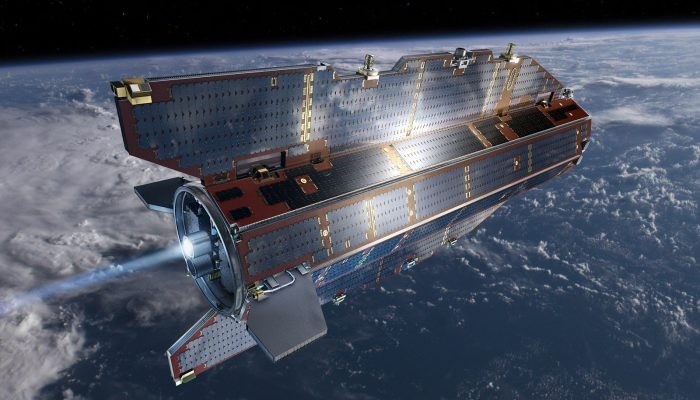
Meanwhile, GOCE is very suitable for the construction of a static model of Earth’s gravity field. Since this satellite has a very low orbit, ~250 km above mean sea level, it has a better spatial resolution. Its accuracy is also better than the previous missions, up to 1 mGal. GOCE is equipped with a gradiometer, which measures the gravity acceleration in three directions (x, y, and z). Afterwards this information is processed into a gravity-gradient dataset containing six components (XX, XY, XZ, YY, YZ, ZZ).
This gravity gradient is the first derivative of the gravity acceleration, which provides us better information about the geometry of the earth’s structure than the gravity acceleration itself. For my PhD, I use this gravity gradient dataset to analyze the lithospheric structure of subduction zones. Before treating the GOCE observation data, I am developing a computational code to calculate the gravity and gravity gradient due to the effect of topography, also called the topographic reduction. The observed gravity and gravity gradient values will be reduced by this topography effect in order to get the anomaly signal. This means that only the signal due to other geodynamic phenomena over the observed area (e.g. slab, isostasy, mantle plum, etc.) is left. By doing further processing, we can obtain the lateral variations of the lithospheric structure in the study areas and then investigate the correlation with the occurrence of mega-earthquakes in these subduction zones.
Since there is still some ambiguity about the information that is produced by gravity data only, it is better to combine the use of them with others geophysical or geological measurements, e.g. seismic tomography measurements and magnetic field observations.
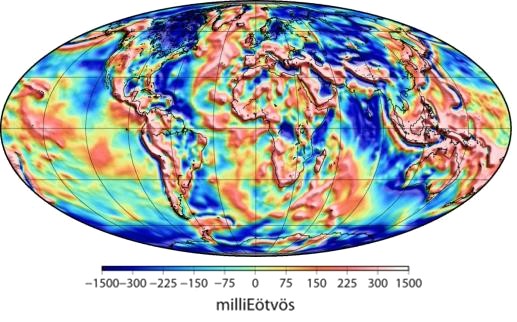
Global coverage of GOCE gravity gradient (in milliEötvös) in radial direction (ZZ) (Panet, I. et al., 2014)
Reference:
Panet, I., Pajot-Métivier, G., Greff-Lefftz, M., Métivier, L., Diament, M. and Mandea, M., 2014. Mapping the mass distribution of Earth/’s mantle using satellite-derived gravity gradients. Nature Geoscience, 7(2), pp.131-135.


Alisha Chinoy
I was particularly amazed by the concept of using satellites to map variations in Earth’s gravitational field. It’s mind-boggling to think that tiny changes in gravity can be detected from space and used to gather valuable data about our planet’s structure and dynamics. The fact that scientists are able to measure the gravitational pull of different regions with such precision is truly remarkable.