Many polar scientists who have traveled to Svalbard have heard several times how most of the stuff there is the “northernmost” stuff, e.g. the northernmost university, the northernmost brewery, etc. Despite hosting the four northernmost cities and towns, Svalbard is however accessible easily by “usual-sized” planes at least once per day from Oslo and Tromsø. This is not the case for th ...[Read More]
Image of the Week – Icy expedition in the Far North
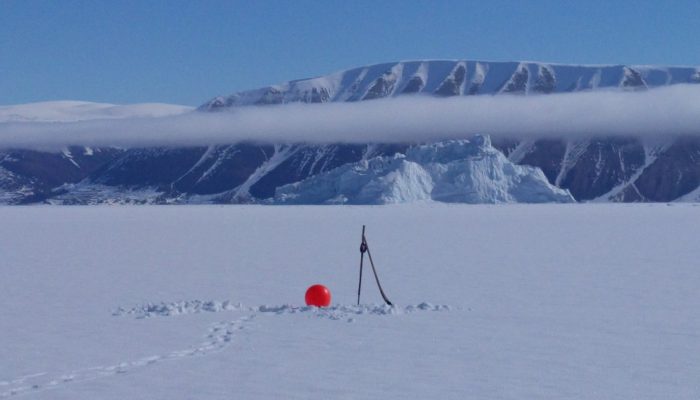
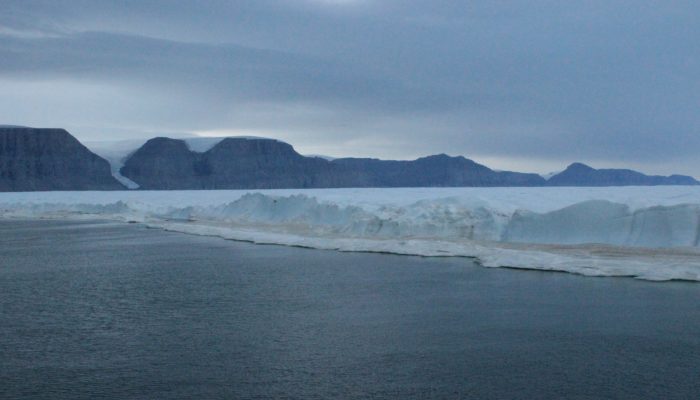
Fig.1: Mooring in the fjord next to Qaanaaq [Credit: Measurement campaign team].