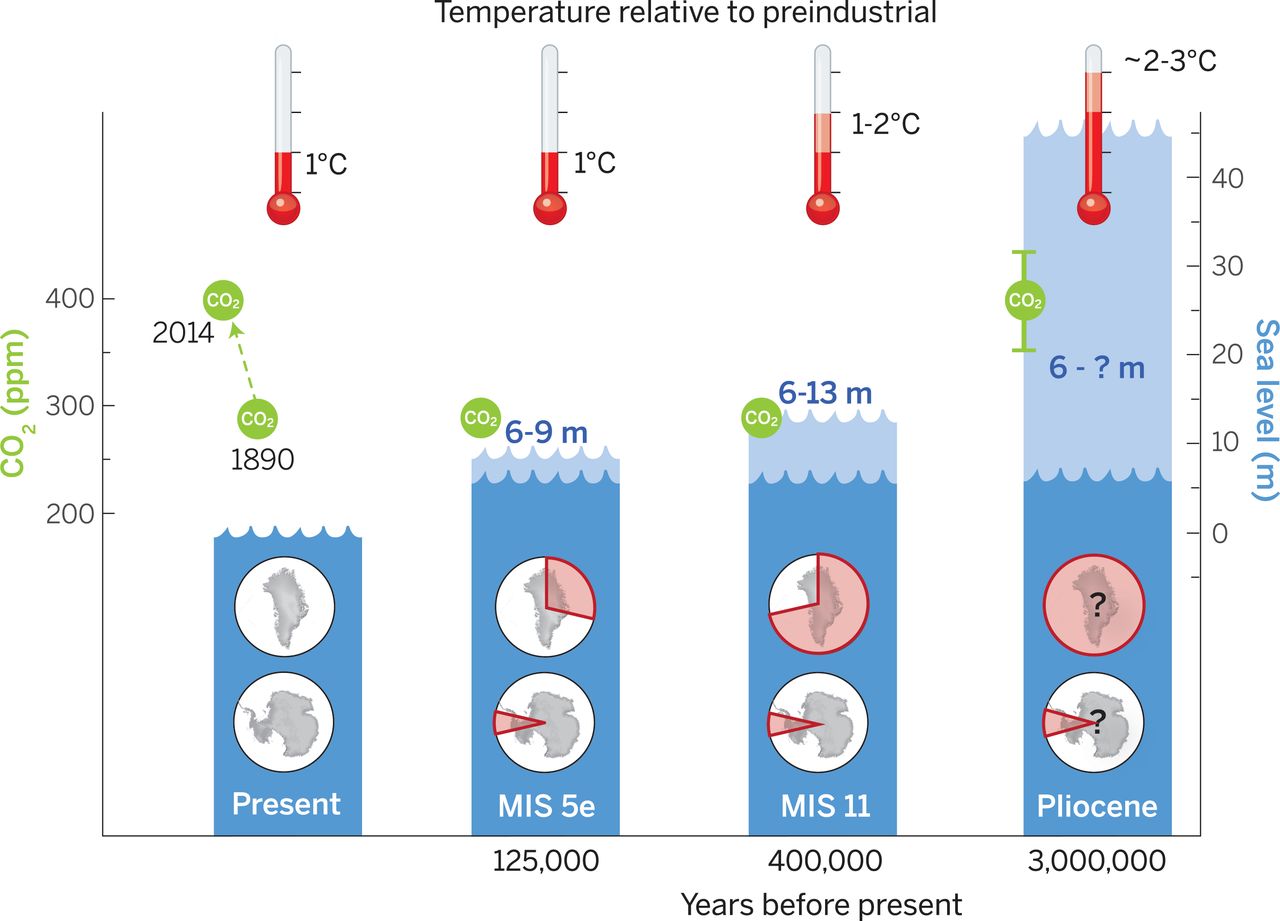
Understanding the climate evolution of our planet is not an easy task, but it is essential to understand the past if we are to predict the future! Historic climate cycles provide us with a glimpse into a period of time when the Earth was warmer than it was today. Our image of the week looks at these warmer periods of time to see what they can tell us about the future! For example, during the Pliocene, the global mean sea level was greater than 6 m higher than it is today… so what can these historic records tell us about the future of the ice sheets and their contribution to sea-level rise?
We will work forward in time from 3 million years ago to present-day and examine the evidence we have about the past climate of Earth. In this time period there have been cycles of warm and cool climate (glacials and interglacials – see our previous post). Here we will examine those interglacial periods where the climate was warmer than the preindustrial period (before 1750).
The Pliocene ~ 3 million years ago
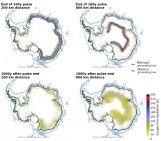
Approximately 3 million years ago during the mid-Pliocene period, the earth experienced climate cycles every 41,000 years, and the atmospheric CO2 ranged from 350 to 450 ppm compared to around 400 ppm today and 250 ppm preindustrial. During the Pliocene period, peak global mean temperatures were on average 1.9ºC to 3.6ºC warmer than preindustrial temperatures. Ice sheet modelers have used these changes in climatic conditions to estimate the retreat of the Antarctic and Greenland ice sheets, which predicted the global mean sea level to rise ~6 and ~7 m, respectively (see our Image of the Week). Others have used geochemical methods to reconstruct historic sea level, which suggest that the global mean sea-level rise was 21 ± 10 m! While these studies provide great reason to be alarmed, they are unfortunately plagued with uncertainty that makes it challenging to provide any robust estimates of future sea-level rise based on the Pliocene period. Fortunately, more data is available from time periods closer to the present.
Marine Isotope Stage 11 (MIS 11) ~ 400 thousand years ago
Approximately 400,000 years ago, the earth experienced an unusually long period of warming, where the global mean temperature was estimated to be 1-2ºC warmer than preindustrial levels (see our Image of the Week). This period is known as MIS 11. Historic records such as pollen records, biomolecules, and ice-rafted debris suggest that the Greenland ice sheet severely retreated to the extent that forests developed on Southern Greenland! Ice sheet modelers estimate that this retreat in Greenland could have contributed 4.5 – 6 m to the global mean sea level rise. Paleoshoreline reconstruction at sites across the globe suggests that that the global mean sea level rise was ~6 – 13 m, which supports the large retreat experienced by the Greenland ice sheet and suggests that the Antarctic ice sheet likely experienced significant retreat as well if those higher estimates of sea level rise (~13 m) occurred.
Marine Isotope Stage 5 (MIS 5e) ~ 125 thousand years ago
Approximately 125,000 years ago, the earth experienced a period of warming approximately 1ºC warmer than preindustrial levels, known as MIS 5e. This warmer period has significantly more data available compared to the other time periods. It is often the case that more recent times have more abundant data and in this caseshorelines that developed during MIS 5e provide an excellent record of global mean sea level being an estimated 6 – 9 m higher than present.
Modeling studies suggest that at this time 0.6 – 3.5 m of sea level rise can be attributed to the retreat of the Greenland ice sheet and ~1 m can be attributed to thermal expansion and the melt of mountain glaciers (see Figure 2). Therefore, despite a lack of mass loss records of the Antarctic ice sheet at this time , it is likely that it underwent considerable retreat to enable contributing to the additional sea level rise.

Figure 2: Compilation of MIS 5e reconstructions for peak GMSL, the Greenland ice sheet contribution, and bets estimate of the total sea level budget [Credit: Dutton et al. (2015)].
What does this all mean for our future…
The further back in time, the larger the sources of uncertainty. Hence, there is fairly limited data regarding the Pliocene that may be used to help predict future conditions. Additionally, it’s important to remember that the climatic cycles in the Earth’s history resulted largely from changes in the Earth’s orbit. This is why the CO2 level associated with MIS 5e and 11 are similar to preindustrial levels, and yet these periods experienced significant increases in global mean temperature accompanied by rises in the global mean sea-level.
what we do know from the past is that both ice sheets experienced significant mass loss during these warm periods that directly impacted sea-level rise.
Today, the CO2 concentrations are around 407 ppm and the peak global mean temperature is approximately 1ºC warmer than preindustrial times (see the Image of the Week). For reference, the Paris Climate Accord is trying to bring our world leaders together to keep the peak global mean temperatures lower than 2ºC above pre-industrial levels. While the cause of the warming periods might be different, what we do know from the past is that both ice sheets experienced significant mass loss during these warm periods that directly impacted sea-level rise. Therefore, it’s very important to monitor and improve our future projections of mass loss from these ice sheets in order to better understand how sea-level rise will affect us.
Further Reading
- Read the paper this article is based on here
Edited by Emma Smith