One of the most time-consuming and stressful parts of any Antarctic research project is simply making a map. Whether it’s plotting your own data points, lines, or images; making the perfect “Figure 1” for your next paper, or replying to a collaborator who says “Just show me a map!,” it seems that quick and effective map-making is a skill that we take for granted. However, finding good map data and tools for Earth’s most sparsely-populated and poorly-mapped continent can be exhausting. The Quantarctica project aims to provide a package of pre-prepared scientific and geographic datasets, combined with easy-to-use mapping software for the entire Antarctic community. This post will introduce you to Quantarctica, but please note that the project is organizing a Quantarctica User Workshop at the 2017 EGU General Assembly (see below for more details).
[Credit: Quantarctica Project]
What is Quantarctica?
Quantarctica is a collection of Antarctic geographic datasets which works with the free, open-source mapping software QGIS. Thanks to this Geographic Information System package, it’s now easier than ever for anyone to create their own Antarctic maps – for any topic and at any spatial scale. Users can add and plot their own scientific data, browse satellite imagery, make professional-quality maps and figures, and much, much more. Read on to learn how researchers are using Quantarctica, and find out how to use it to start making your own (Qu-)Antarctic maps!
Project Origins
When you make a sandwich, you start with bread, not flour. So why would you start with ‘flour’ to do your science?” — Kenny Matsuoka, Norwegian Polar Institute
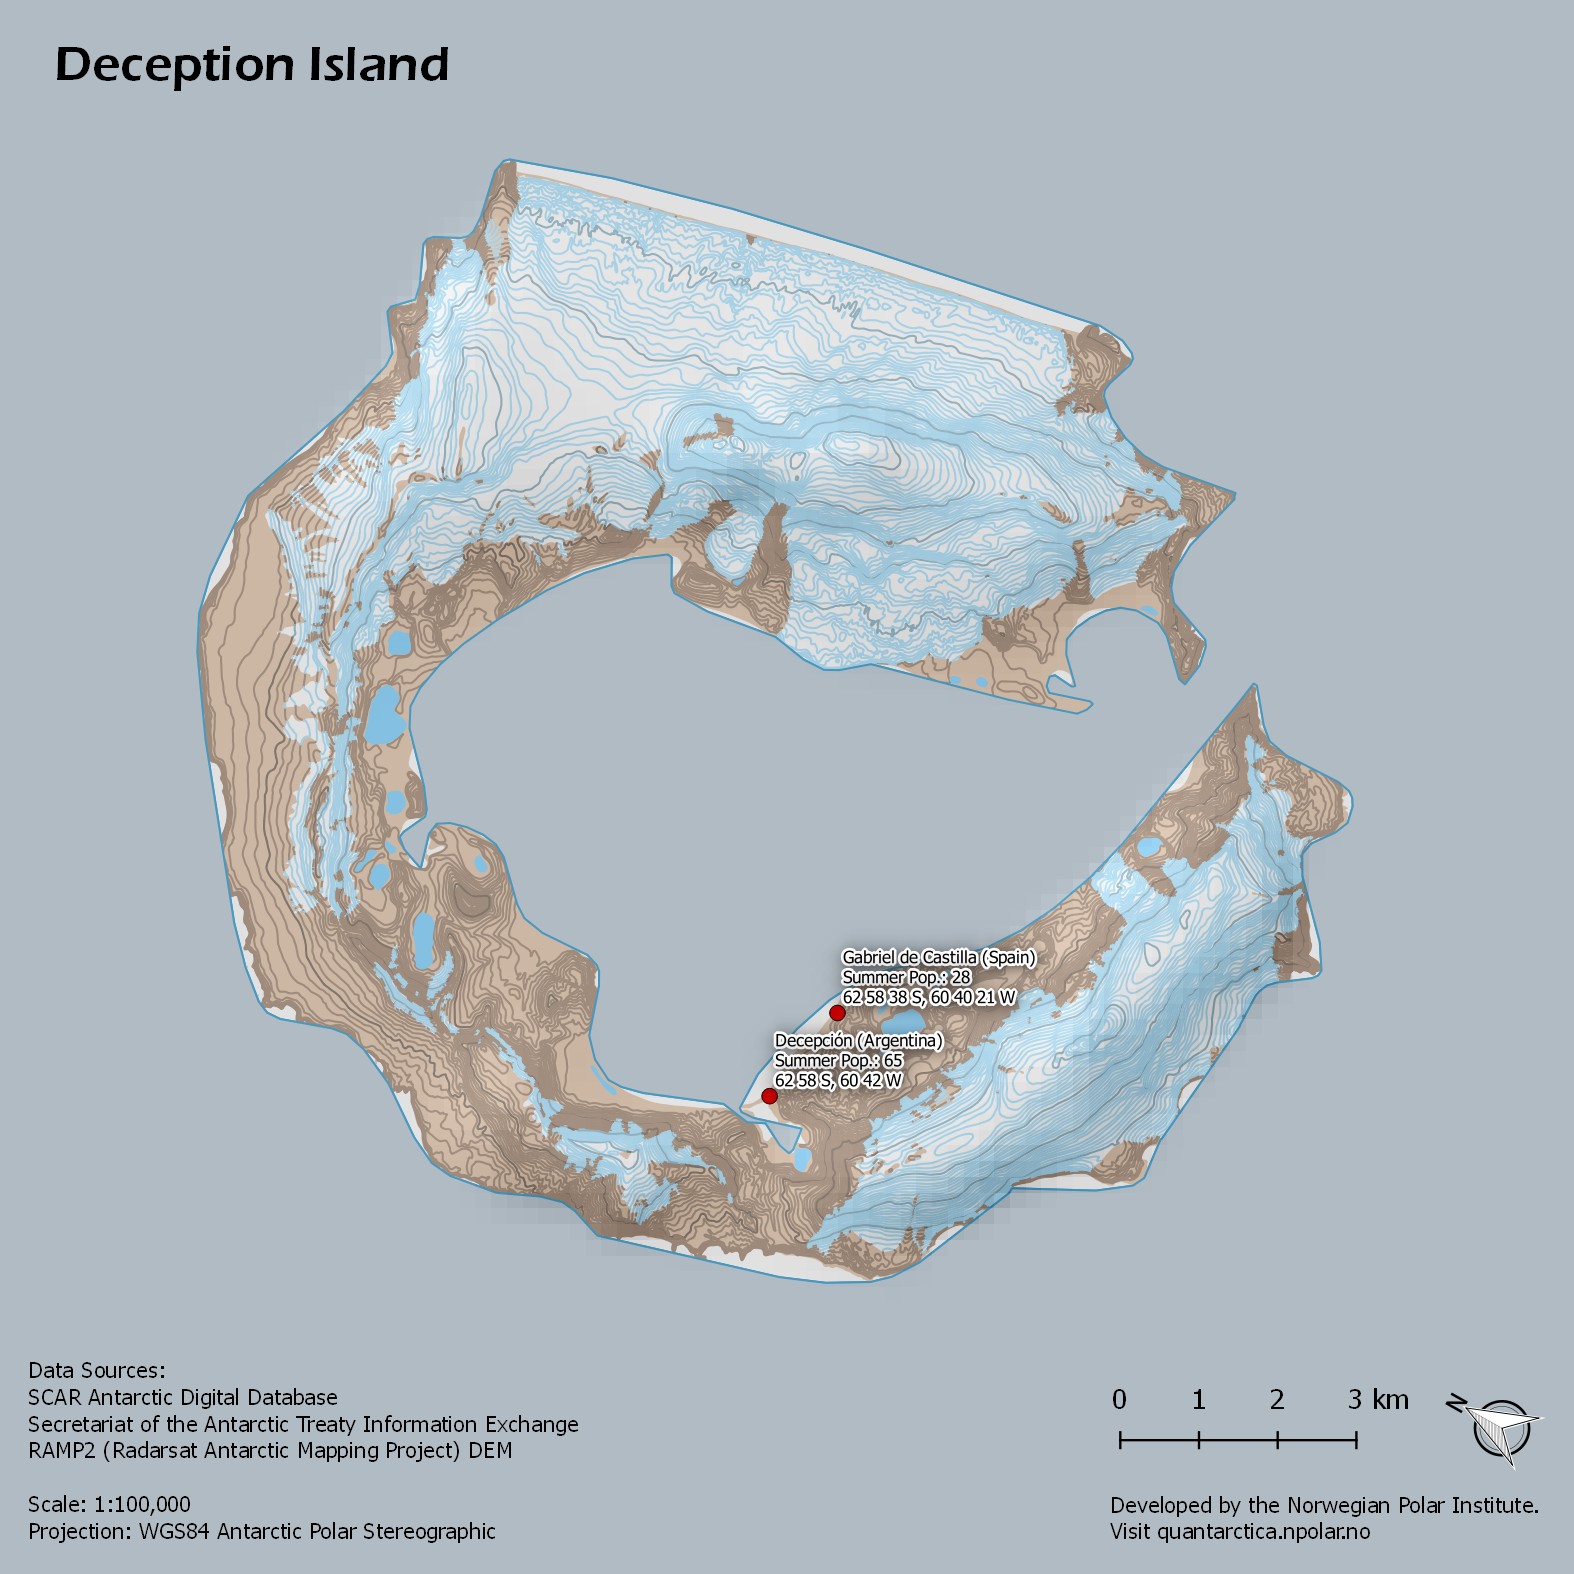
Deception Island isn’t so deceptive anymore, thanks to Quantarctica’s included basemap layers, customized layer styles, and easy-to-use cartography tools. [Credit: Quantarctica Project]
Necessity is the mother of invention, and people who work in Antarctica are nothing if not inventive. When Kenny Matsuoka found himself spending too much time and effort just locating other Antarctic datasets and struggling with an expired license key for his commercial Geographic Information System (GIS) software in the field, he decided that there had to be a better way – and that many of his Antarctic colleagues were probably facing the same problems. In 2010, he approached Anders Skoglund, a topographer at the Norwegian Polar Institute, and they decided to collaborate and combine some of the critical scientific and basemap data for Antarctica with the open-source, cross-platform (Windows, Mac, and Linux) mapping software QGIS. Quantarctica was born, and was quickly made public for the entire Antarctic community.
Since then, maps and figures made with Quantarctica have appeared in at least 25 peer-reviewed journal articles (that we can find!). We’ve identified hundreds of Quantarctica users, spread among every country participating in Antarctic research, with especially high usage in countries with smaller Antarctic programs. We’ve been actively incorporating even more datasets into the project, teaching user workshops at popular Antarctic conferences – such as EGU 2017 – and building educational materials on Antarctic mapping for anyone to use.
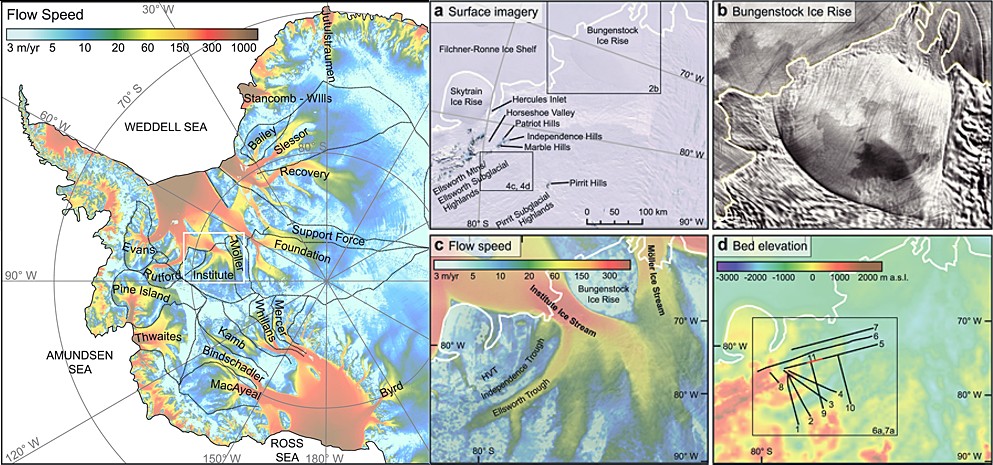
A great example of a Quantarctica-made figure published in a paper. Elevation, imagery , ice flow speeds, latitude/longitude graticules, custom text and drawing annotations… it’s all there and ready for you to use! [Credit: Figs 1 and 2 from Winter et al (2015)].
What data can I find in Quantarctica?
- Continent-wide satellite imagery (Landsat, MODIS, RADARSAT)
- Digital elevation models and/or contour lines of bed and ice-surface topography and seafloor bathymetry
- Locations of all Antarctic research stations and every named location in Antarctica (the SCAR Composite Gazetteer of Antarctica)
- Antarctic and sub-Antarctic coastlines and outlines for exposed rock, ice shelf, and subglacial lakes
- Magnetic and gravity anomalies
- Ice flow velocities, catchment areas, mass balance, and firn thickness grids
- Ancient UFO crash sites
…just to name a few!
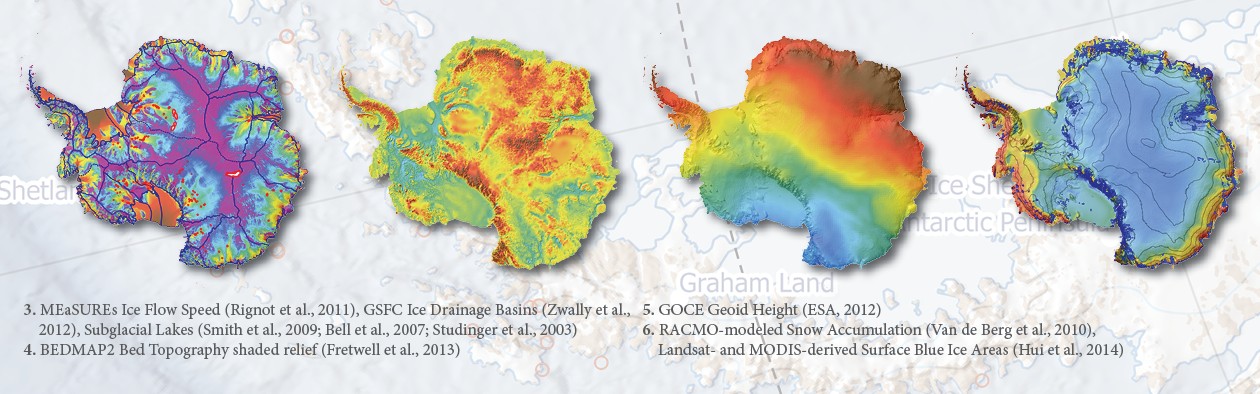
Four examples of included datasets. From left to right: Ice flow speed, drainage basins, and subglacial lakes; bed topography; geoid height; modeled snow accumulation and surface blue ice areas [Credit: Quantarctica Project]
All of these datasets have been converted, imported, projected to a standard Antarctic coordinate system, and hand-styled for maximum visibility and compatibility with other layers. All you have to do is select which layers you want to show! The entire data package is presented in a single QGIS project file that you can quickly open, modify, save, and redistribute as your own. We also include QGIS installers for Windows and Mac, so everything you need to get started is all in one place. And finally, all of the data and software operates entirely offline, with no need to connect to a license server, so whether you’re in a tent in Antarctica or in a coffee shop with bad wi-fi, you can still work on your maps!
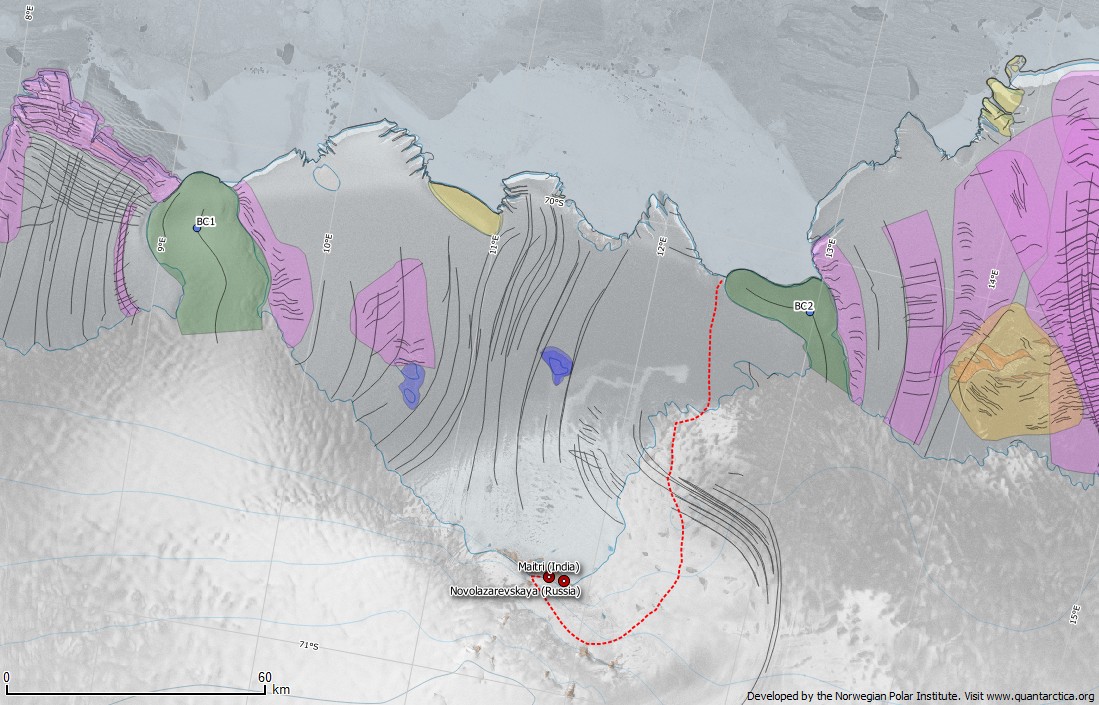
Quantarctica was used in traverse planning for the MADICE Project, a collaboration between India’s National Centre for Antarctic and Ocean Research (NCAOR) and the Norwegian Polar Institute (NPI), investigating mass balance, ice dynamics, and climate in central Dronning Maud Land. Check out pictures from their recently-completed field campaign on Facebook and Twitter! Base image: RADARSAT Mosaic; Ice Rises: Moholdt and Matsuoka (2015); Mapping satellite features on ice: Ian Lee, University of Washington; Traverse track: NCAOR/NPI. [Credit: Quantarctica Project]
Every dataset in Quantarctica is free for non-commercial use, modification, and redistribution – we get explicit permission from the data authors before their datasets are included in Quantarctica, always include any README or extra license/disclaimer files, and never include a dataset if it has any stricter terms than that. We always provide all metadata and citation information, and require that any Quantarctica-made maps or figures printed online or in any publication include citations for the original datasets.
How do I start using Quantarctica?
Quantarctica is available for download at http://quantarctica.npolar.no/. It’s a 6 GB package, so if your internet connection is struggling with the download, just contact us and we can send it to you on physical media. You can use the bundled QGIS installers for your operating system, or download the latest version of QGIS at http://qgis.org/ and simply open the Quantarctica project file, Quantarctica.qgs, after installation.
We’re actively developing Version 3 of Quantarctica, for release in Late 2017. Do you know of a pan-Antarctic dataset that you think should be included in the new version? Just email the Quantarctica project team at quantarctica@npolar.no.
Quantarctica makes it easy to start using QGIS, but if you’ve never used mapping software before or need to brush up on a few topics, we recommend QGIS Tutorials and Tips and the official QGIS Training Manual. There are also a lot of great YouTube tutorial videos out there!
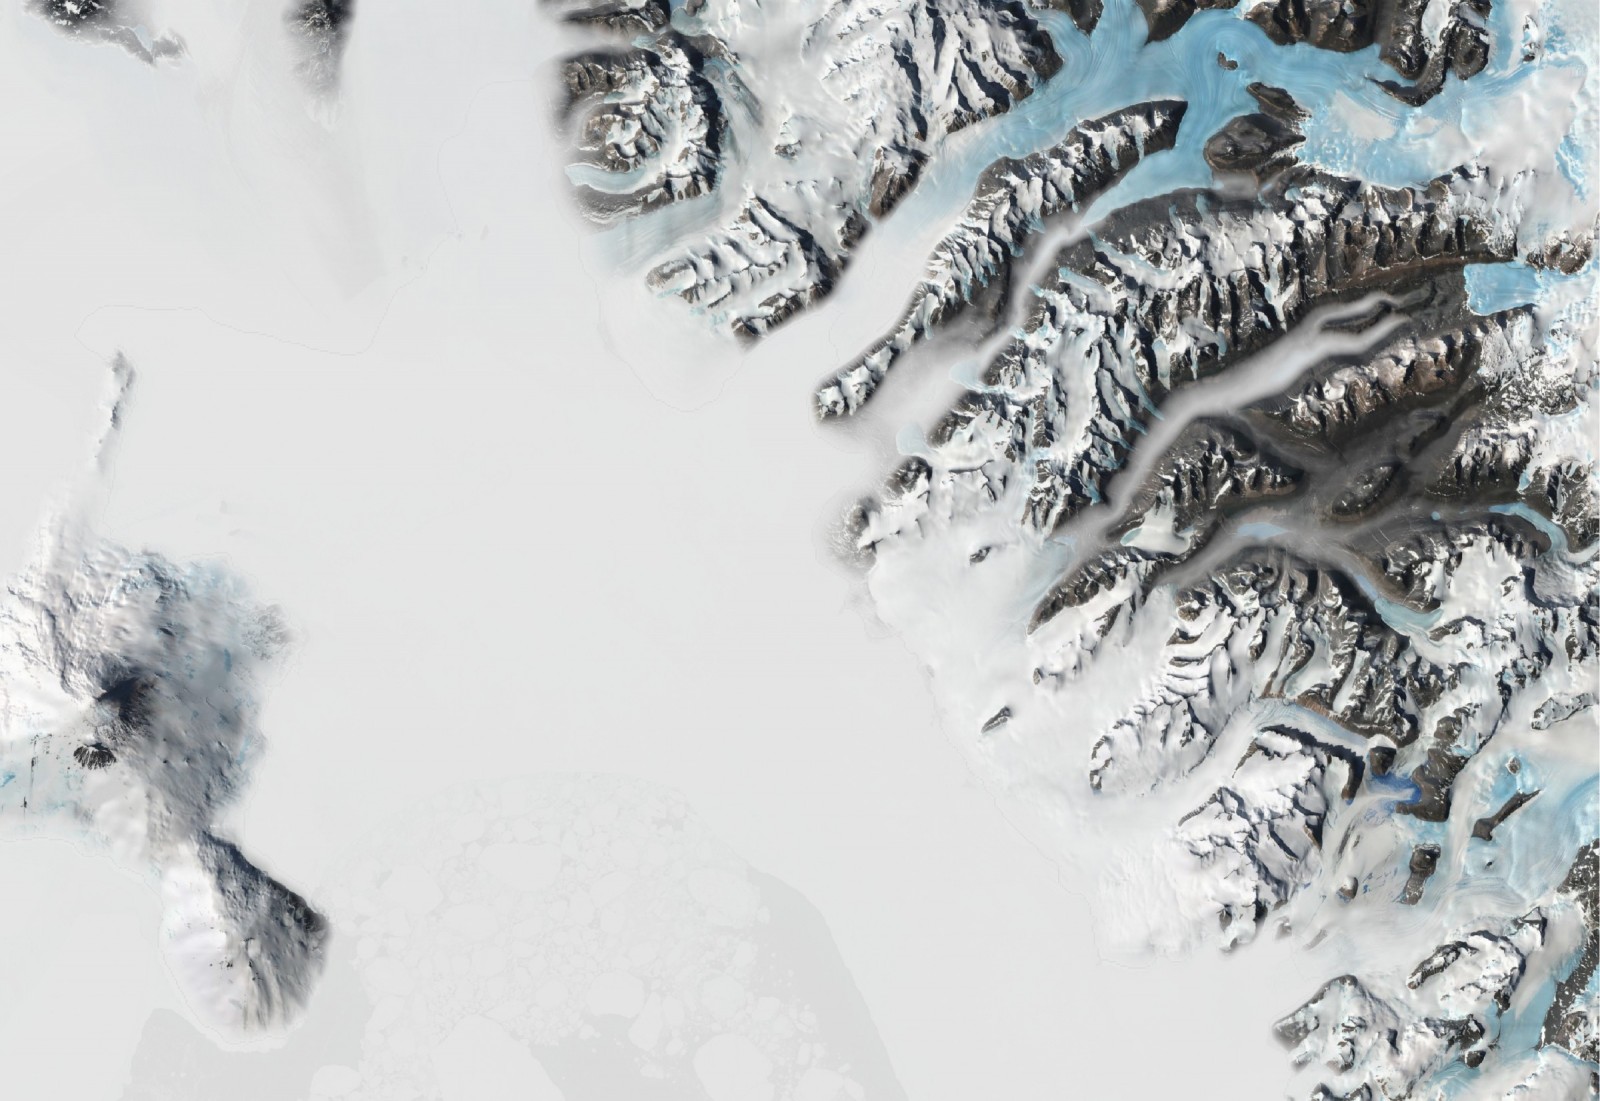
Nobody said you could only use Quantarctica for work – you can use it to make cool desktop backgrounds, too! Foggy day in the Ross Island / McMurdo Dry Valleys area? Though it often is, the fog effects image was created using only the LIMA 15m Landsat Imagery Mosaic and RAMP2 DEM in Quantarctica, with the help of this tutorial. [Credit: Quantarctica Project]
Quantarctica Short Course at EGU 2017
Are you attending EGU 2017 and want to learn how to analyze your Antarctic data and create maps using Quantarctica? The Quantarctica team will be teaching a short course (SC32/CR6.15) on Monday, 24 April at 13:30-15:00 in room -2.31. Some basic GIS/QGIS experience is encouraged, but not required. If you’re interested, fill out the registration survey here: https://goo.gl/forms/mLaJg686tZq8bm2N2 and feel free to send any questions or comments to quantarctica@npolar.no. We’ll see you in Vienna!
Edited by Kenny Matsuoka and Sophie Berger
Reference/Further Reading
- Quantarctica homepage
- Quantarctica User Workshop at EGU2017 and Registration
- Quantarctica at the Free and Open Source Software (FOSS) for Geoinformatics and Geosciences PICO Session (ESSI3.4), EGU 2017
Data sources
- SCAR Antarctic Digital Database, v6: http://www.add.scar.org/
- IBCSO Bathymetry: Arndt, J. E., et al. (2013), The International Bathymetric Chart of the Southern Ocean (IBCSO) Version 1.0—A new bathymetric compilation covering circum-Antarctic waters, Geophys. Res. Lett., 40, 3111–3117, doi:10.1002/grl.50413. http://doi.pangaea.de/10.1594/PANGAEA.805734?format=html
- Surface elevation: RAMP2 DEM: Liu, H., K. C. Jezek, B. Li, and Z. Zhao. 2015. Radarsat Antarctic Mapping Project Digital Elevation Model, Version 2. Boulder, Colorado USA. NASA National Snow and Ice Data Center Distributed Active Archive Center. http://nsidc.org/data/nsidc-0082.html
- MEaSUREs Ice Flow Velocities: Rignot, E., J. Mouginot, and B. Scheuchl. 2011. MEaSUREs InSAR-Based Antarctica Velocity Map. Boulder, Colorado USA: NASA EOSDIS Distributed Active Archive Center at NSIDC. http://nsidc.org/data/nsidc-0484.html
- ETOPO1 Terrain: http://www.ngdc.noaa.gov/mgg/global/global.html
- ASAID Grounding Line: Bindschadler, R., H. Choi, and ASAID Collaborators. 2011. High-resolution Image-derived Grounding and Hydrostatic Lines for the Antarctic Ice Sheet. Boulder, Colorado, USA: National Snow and Ice Data Center. Digital media. http://nsidc.org/data/docs/agdc/nsidc0489_bindschadler/index.html
- Surface Elevation: Bamber, J. L., J. L. Gomez-Dans, and J. A. Griggs. 2009. A New 1 km Digital Elevation Model of the Antarctic Derived from Combined Satellite Radar and Laser Data Part 1: Data and Methods. The Cryosphere, 3, 101-111. http://nsidc.org/data/docs/daac/nsidc0422_antarctic_1km_dem/
- RADARSAT Mosaic: http://bprc.osu.edu/rsl/radarsat/data/download.php?mission=amm_v2&path=MOSAICS/amm1_mosaics_linear_scale&files=amm1mos_100m&tar=1
- Winter, K., J. Woodward, N. Ross, S. A. Dunning, R. G. Bingham, H. F. J. Corr, and M. J. Siegert (2015), Airborne radar evidence for tributary flow switching in Institute Ice Stream, West Antarctica: Implications for ice sheet configuration and dynamics, J. Geophys. Res. Earth Surf., 120, 1611–1625, doi:10.1002/2015JF003518. Creative Commons License: Attribution 4.0 International (CC BY 4.0)
- Grima, C., J. S. Greenbaum, E. J. Lopez Garcia, K. M. Soderlund, A. Rosales, D. D. Blankenship, and D. A. Young (2016), Radar detection of the brine extent at McMurdo Ice Shelf, Antarctica, and its control by snow accumulation, Geophys. Res. Lett., 43, doi:10.1002/2016GL069524. Creative Commons License: Attribution-NonCommercial-NoDerivatives 4.0 International (CC BY-NC-ND 4.0)
- Antarctic Treaty System Facilities: http://www.ats.aq/devAS/ie_permanent.aspx?lang=e
- Ice Drainage Basins: Zwally, H. Jay; Giovinetto, Mario B.; Li, Jun; Cornejo, Helen G.; Beckley, Matthew A.; Brenner, Anita C.; Saba, Jack L.; Yi, Donghui. (2005). Mass changes of the Greenland and Antarctic ice sheets and shelves and contributions to sea-level rise: 1992–2002. Journal of Glaciology, 51(175), 509-527. http://icesat4.gsfc.nasa.gov/cryo_data/ant_grn_drainage_systems.php
- Subglacial Lakes: Smith, B. E., H. A. Fricker, I. R. Joughin, and S. Tulaczyk (2009), An inventory of active subglacial lakes in Antarctica detected by ICESat (2003-2008), J. Glaciol., 55(192), 573-595
Bell, R., M. Studinger, C.A. Shuman, M.A. Fahnestock and I. Joughin (2007), Large subglacial lakes in East Antarctica at the onset of fast-flowing ice streams, Nature, 445, 904-907.
Studinger, M., R.E. Bell, G.D. Karner, A.A. Tikku, J.W. Holt, D.L. Morse, T.G. Richter, S.D. Kempf, M.E. Peters, D.D. Blankenship, R.E. Sweeney, V.L. Rystrom (2003), Ice cover, landscape setting, and geological framework of Lake Vostok, East Antarctica. Earth Planet. Sci. Lett., 205, 195-210. - BEDMAP2 Bed Topography: Fretwell, P., Pritchard, H. D., Vaughan, D. G., Bamber, J. L., Barrand, N. E., Bell, R., Bianchi, C., Bingham, R. G., Blankenship, D. D., Casassa, G., Catania, G., Callens, D., Conway, H., Cook, A. J., Corr, H. F. J., Damaske, D., Damm, V., Ferraccioli, F., Forsberg, R., Fujita, S., Gim, Y., Gogineni, P., Griggs, J. A., Hindmarsh, R. C. A., Holmlund, P., Holt, J. W., Jacobel, R. W., Jenkins, A., Jokat, W., Jordan, T., King, E. C., Kohler, J., Krabill, W., Riger-Kusk, M., Langley, K. A., Leitchenkov, G., Leuschen, C., Luyendyk, B. P., Matsuoka, K., Mouginot, J., Nitsche, F. O., Nogi, Y., Nost, O. A., Popov, S. V., Rignot, E., Rippin, D. M., Rivera, A., Roberts, J., Ross, N., Siegert, M. J., Smith, A. M., Steinhage, D., Studinger, M., Sun, B., Tinto, B. K., Welch, B. C., Wilson, D., Young, D. A., Xiangbin, C., and Zirizzotti, A.: Bedmap2: improved ice bed, surface and thickness datasets for Antarctica, The Cryosphere, 7, 375-393, doi:10.5194/tc-7-375-2013, 2013. https://www.bas.ac.uk/project/bedmap-2/
-
GOCE Geoid Height: Retrieved from Third Generation GOCE Direct Solution: GO_CONS_EGM_GOC_2__20091101T000000_20110430T235959_0001.TGZ
Originators: https://earth.esa.int/web/guest/missions/esa-operational-eo-missions/goce/content?p_r_p_564233524_assetIdentifier=goce-data-overview-5706
Publisher: ESA - Snow Accumulation: Van de Berg, W. J., van den Broeke, M. R., and van Meijgaard, E.: Reassessment of the Antarctic surface mass balance using calibrated output of a regional atmospheric climate model, J. Geophys. Res., 111, D11104, doi:10.1029/2005JD006495, 2006. http://doi.pangaea.de/10.1594/PANGAEA.734145
-
Blue Ice areas: Hui, F.M., T.Y. Ci, X. Cheng, T.A. Scambos, Y. Liu, Y.M. Zhang, Z.H. Chi, H.B. Huang, X.W. Wang, F. Wang, C. Zhao and Z.Y. Jin 2014. Mapping blue ice areas in Antarctica using ETM+ and MODIS data. Annals of Glaciology, 55(66): 129-137.
-
Ice Rises: Matsuoka, K., Hindmarsh, R. C., Moholdt, G., Bentley, M. J., Pritchard, H. D., Brown, J., … & Hattermann, T. (2015). Antarctic ice rises and rumples: Their properties and significance for ice-sheet dynamics and evolution. Earth-science reviews, 150, 724-745. http://dx.doi.org/10.1016/j.earscirev.2015.09.004
 George Roth is the Quantarctica Project Coordinator in the Glaciology group (@NPIglaciology) at the Norwegian Polar Institute. He has spent the last several years helping researchers with GIS, cartography, and remote sensing in both the Arctic and Antarctic.
Pingback: Cryospheric Sciences | Image of the Week – Antarctica’s Flowing Ice, Year by Year