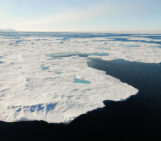
Sea ice is an important part of the Earth’s climate system. When sea ice forms, it releases heat and salt. When sea ice melts, it takes up heat and adds freshwater to the salty ocean water. It is also important for the exchange of energy between the atmosphere and the ocean surface, and for the ocean currents that transport warm and cold water from the equator to the poles and back.
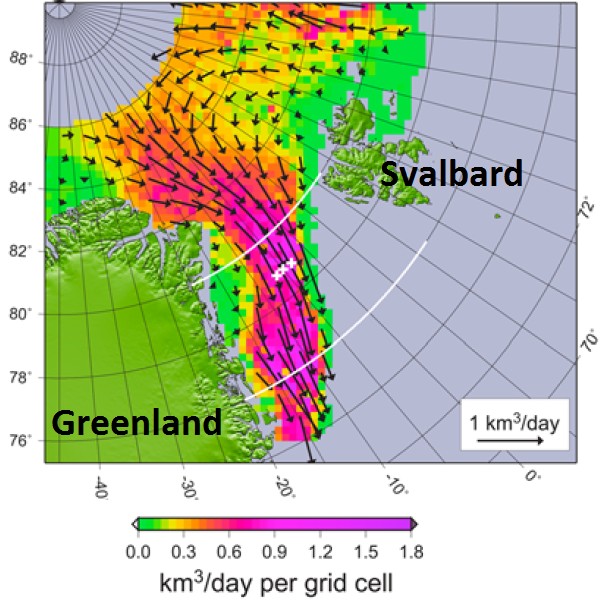
The main route of sea ice moving south from the Arctic Ocean is through Fram Strait. This is the passage between Greenland and Svalbard around 75-80°N latitude (see map). Today’s “Image of the Week” shows the amount of sea ice that flows through this pathway each day (known as the mean observed volume flux) for October-November 2006.
What is sea ice volume flux and how is it computed?
Sea ice volume flux sounds a bit wordy – so what is it and why do we use it? Let’s start with the sea ice volume – this simply tells us how much sea ice there is. In order to calculate the volume, you need to know not only the concentration of sea ice (i.e. the fraction of ocean covered by ice) but also its thickness. The flux parts comes in when we want to talk about the amount of sea ice moving through an area (e.g. Fram Strait). In order to calculate sea ice volume flux, you need to know both sea ice volume and drift. The latter is the displacement of sea ice over a certain period of time, typically measured in kilometres per day. So the volume flux is basically a measure of the volume of ice that moves through a certain area over a given time! Simple!?
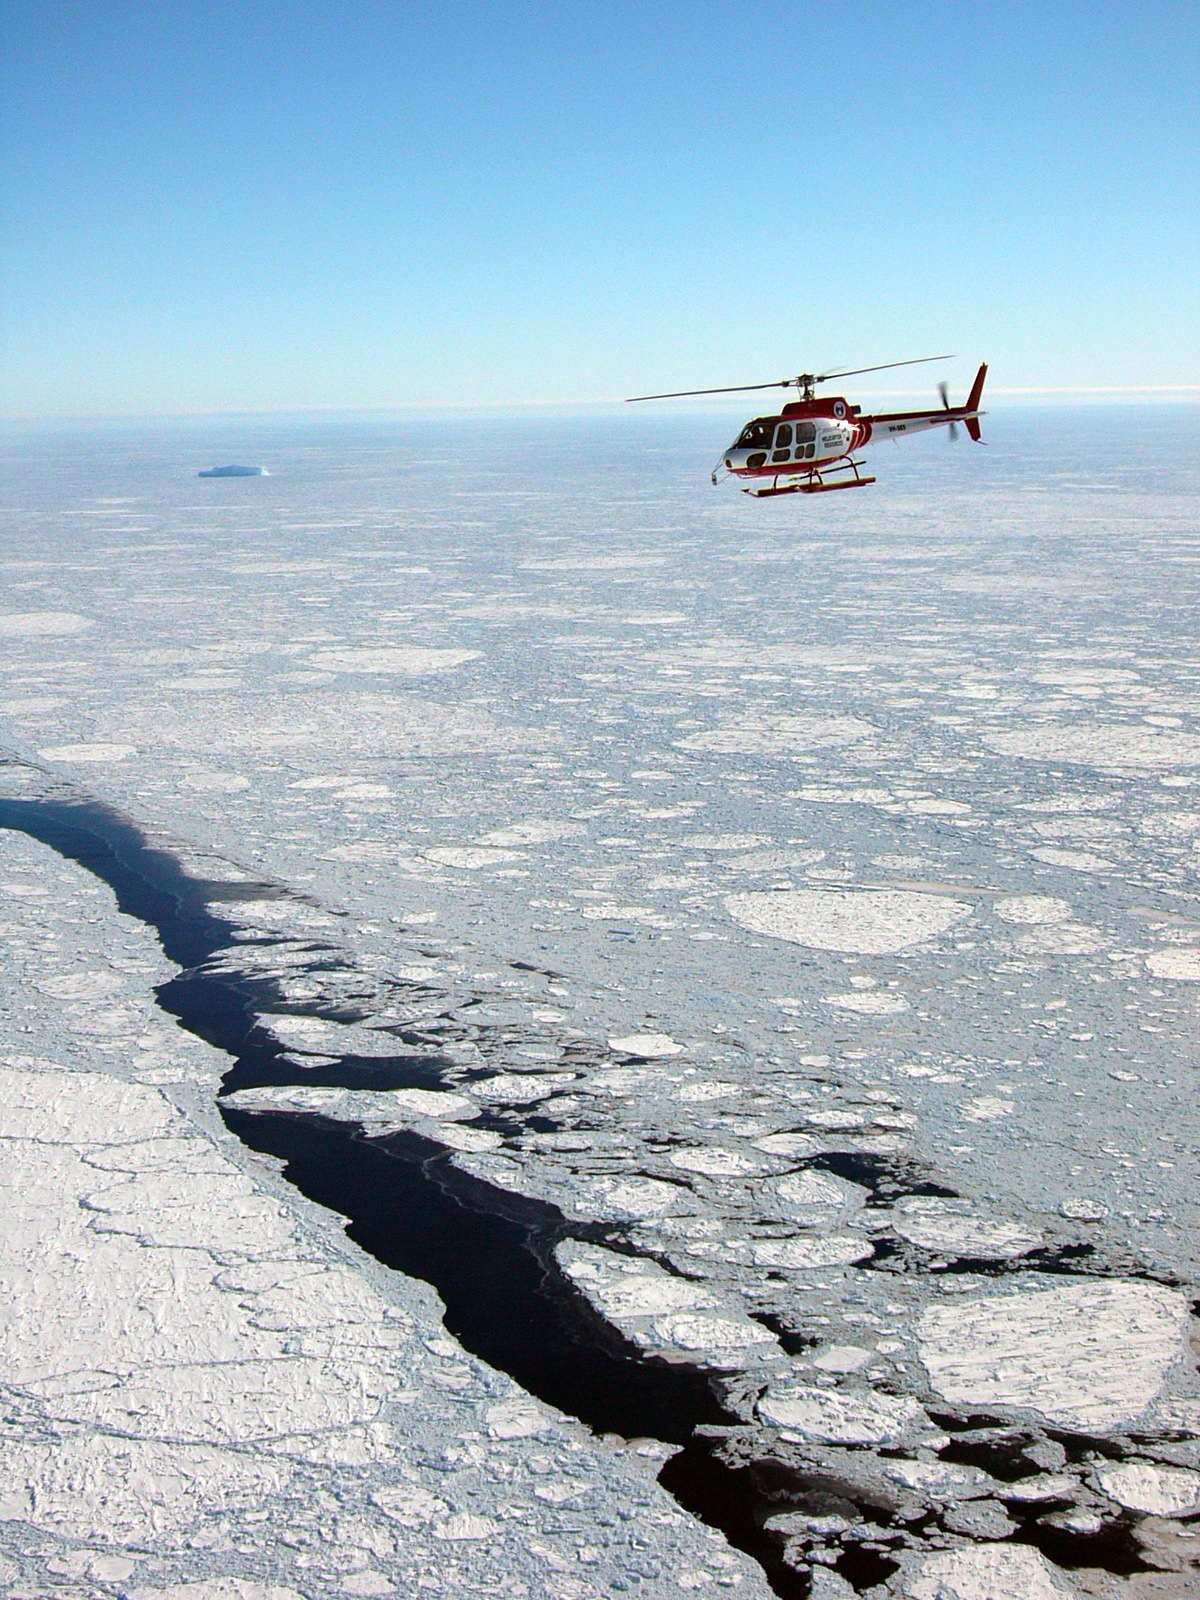
An aerial view of the helicopter taking data of the sea ice below. Photo credit: Alice O’Connor.
What does the “Image of the Week” show?
The map was constructed by Spreen et al. (2009) from satellite data and provided one of the first estimates of sea ice volume flux through Fram Strait exclusively using satellites. However, it is challenging to accurately measure sea ice thickness in the summer using satellites because of the melt ponds (pools of open water forming on sea ice when temperatures are higher, i.e. summer) that interfere with the satellite signals. A few measurements of sea ice thickness have been collected in the summer from British and US submarines in the 1980s and 1990s but only in the region near the pole. A recent study presents a way to compute sea ice volume fluxes through Fram Strait in the summer using a new dataset of ground-based and airborne electromagnetic ice thickness measurements (Krumpen et al., 2016).
In this new study, the concentration of sea ice is found from satellite measurements (passive microwave sensors to be specific). The sea ice drift can be found by using both satellite data and observations from buoys. Finally, the thickness of the sea ice comes from surveys using radar instruments on the ground or from an aircraft. This data was collected during 5 summers, by combining the three of these measurements, Krumpen et al., (2016) calculated the sea ice volume flux during the summer!
In the figure below, the red lines show the sea ice area flux using the concentration and drift only through Fram Strait in July and August from 1980 to 2012. Positive values mean that sea ice moves out of the Arctic Basin, while negative values represent sea ice that goes into the Arctic Basin. The figure shows that there are large variations in sea ice area flux from year to year.
The black dots are the volume fluxes (area flux times thickness) for the 5 summer seasons where the ice thickness was measured. The dots show that in some summers sea ice volume flux is negative, meaning that sea ice moves into the Arctic Basin. In other summers, for example in 2010, sea ice moves out of the Arctic Basin.
![July (black, gray shading for uncertainty) and August (red, light red shading for uncertainty) sea ice area fluxes through Fram Strait (left axis). Black dots show sea ice volume flux for the 5 campaigns during which ice thickness is computed using electromagnetic measurements (right axis). Positive values mean that sea ice is moving out out of the Arctic Ocean while negative values mean that sea ice is flowing into the Arctic Ocean. [Figure 8 of Krumpen et al. (2016)]](https://blogs.egu.eu/divisions/cr/files/2016/09/fig2.jpg)
July (black, gray shading for uncertainty) and August (red, light red shading for uncertainty) sea ice area fluxes through Fram Strait (left axis). Black dots show sea ice volume flux for the 5 campaigns during which ice thickness is computed using electromagnetic measurements (right axis). Positive values mean that sea ice is moving out out of the Arctic Ocean while negative values mean that sea ice is flowing into the Arctic Ocean. [Figure 8 of Krumpen et al. (2016)]
What comes next…
If field campaigns in the future continue to measure sea ice thickness in the summer, the calculations can be continued and we will learn more about the volume of sea ice that is transported through Fram Strait in the summer. This is important if we are to measure the balance of sea ice in the Arctic Ocean.
Edited by Nanna B. Karlsson
 David Docquier is a post-doctoral researcher at the Earth and Life Institute of Université catholique de Louvain (UCL) in Belgium. He works on the development of processed-based sea-ice metrics in order to improve the evaluation of global climate models (GCMs). His study is embedded within the EU Horizon 2020 PRIMAVERA project, which aims at developing a new generation of high-resolution GCMs to better represent the climate.