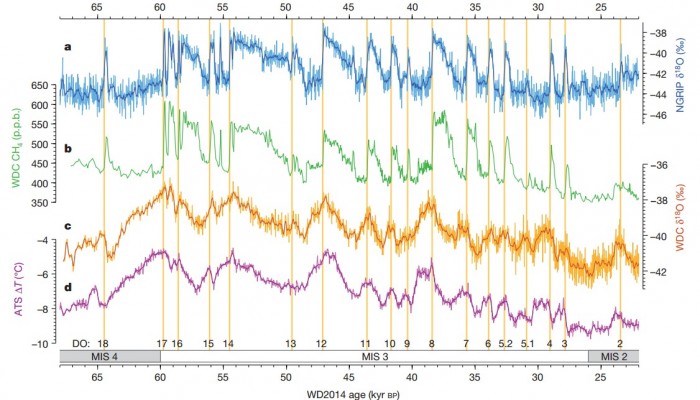
The colourful graphs above show how the climate changed in the period from 65 to 25 thousand years ago when Earth was experiencing an ice age. A wealth of information on the dynamics of our climate is embedded in the curves, especially how the northern and southern hemisphere interact, and how fast climate can change.
The figure represents thousands and thousands of hours of work by scientists, technicians and logistics personnel. It shows the latest results from analyses of an ice core drilled in the middle of the West Antarctic Ice Sheet: The WAIS ice core.
What are we looking at?
In the top part of the figure, the blue curve shows oxygen-isotope values from the North Greenland Ice Core Project. The curve represents temperature in the northern hemisphere where the peaks are high temperatures.
→ First take home message: During the last ice age, the temperatures in Greenland changed very abruptly from cold to warm temperatures. These changes are marked with yellow lines in the figure.
The green curve shows the amount of methane gas in the Antarctic WAIS core. The shape of the methane curve is very similar to the blue temperature (oxygen-isotope) curve from Greenland. The rapid changes in temperatures in Greenland are reflected in the amount of methane in Antarctica.
→ Second take home message: Methane is a “well-mixed” atmospheric gas. This means that if you measure the amount of methane in the air anywhere on Earth, you will get a good indication of the amount of methane on a global level.
The third and fourth curves show the oxygen-isotope values from WAIS (yellow) and the temperatures (purple). In contrast to the Greenland temperatures, the temperatures in Antarctica do not show very fast changes. Instead, we see a slow cycle of rising and falling temperatures.
→ Third take home message: When Greenland experiences a fast warming, Antarctica slowly begins to cool. When Greenland slowly cools, Antarctica begins to warm.
But what does it all mean?
It means that changes in temperature in the northern hemisphere affect the southern hemisphere but with a mechanism that is slightly delayed. This mechanism is of course the ocean. In climate science, this up-and-down pattern is called “the bipolar seesaw” (read more here).
Why is it important?
It is important because it tells us something about how the climate system reacts to abrupt changes. A change in the northern hemisphere is transmitted to the southern hemisphere but not necessarily immediately.
Want to know more?
Read the whole paper here.
Edited by Emma Smith and Sophie Berger


Pingback: Cryospheric Sciences | Ice Cores “For Dummies”
Pingback: Cryospheric Sciences | Image of the Week – The Sound of an Ice Age